Virtual Server Monitoring
The monitoring graphs show the current and historic utilization of virtual server’s resources from the perspective of the compute node.
| Access Permissions | |
| SuperAdmin | read-only |
| DCAdmin | read-only |
| VmOwner | read-only |
CPU Graphs
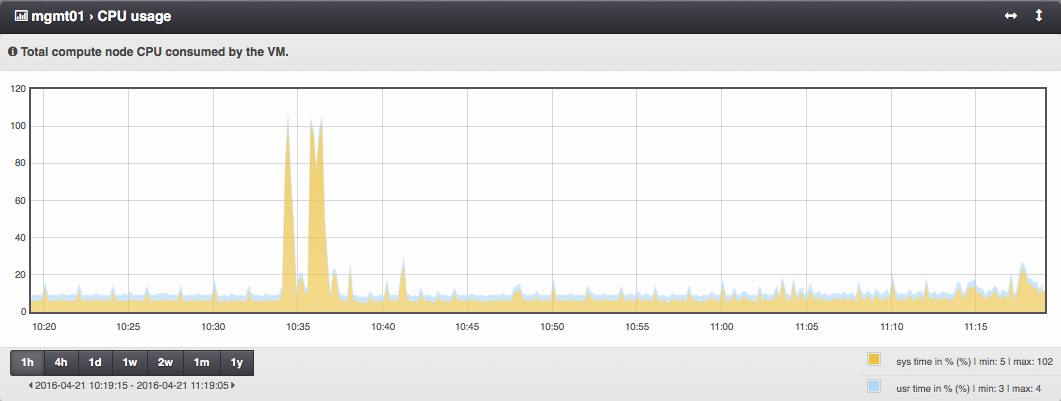
CPU usage - Total compute node CPU consumed by the virtual machine.
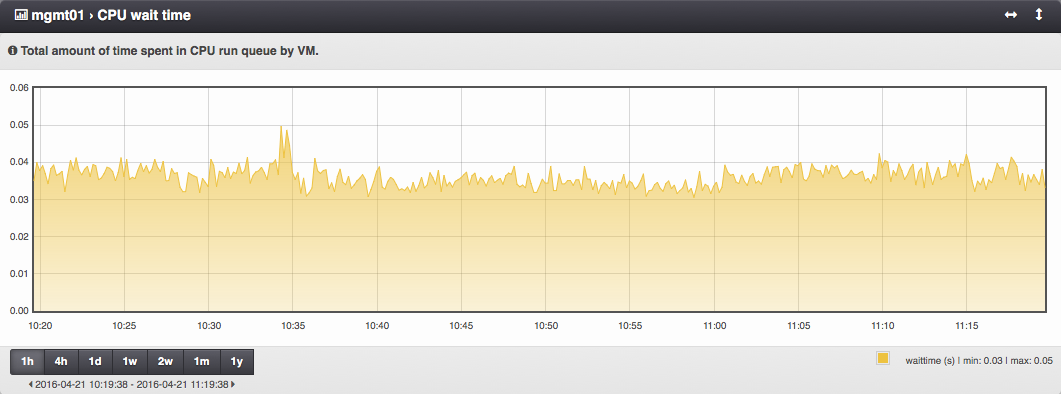
CPU wait time - Total amount of time spent in CPU run queue by the virtual machine.
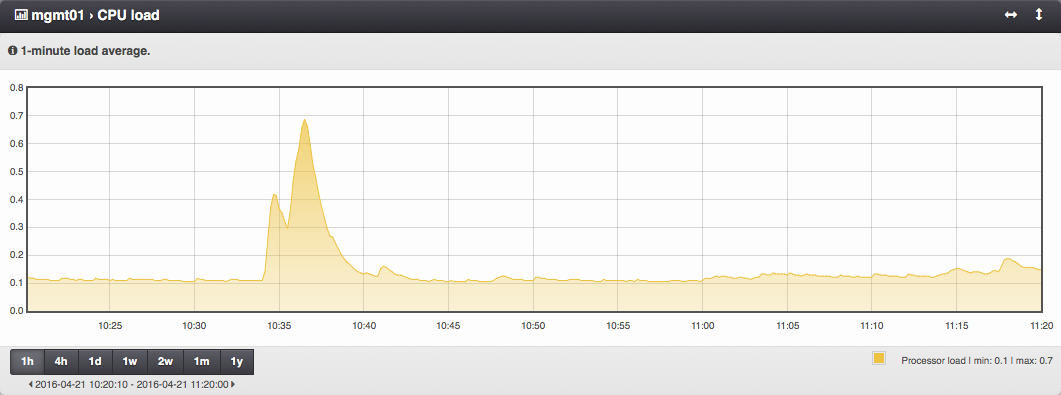
CPU load - One-minute load average.
Memory Graphs
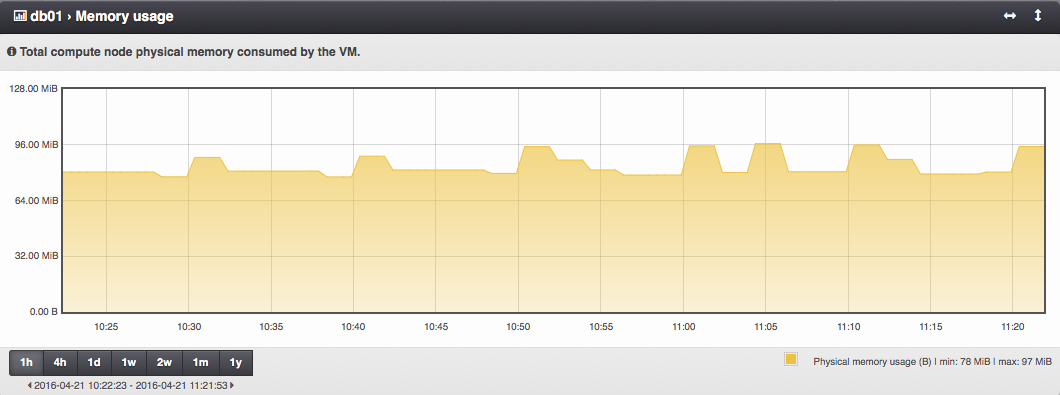
Memory usage - Total compute node physical memory consumed by the virtual machine.
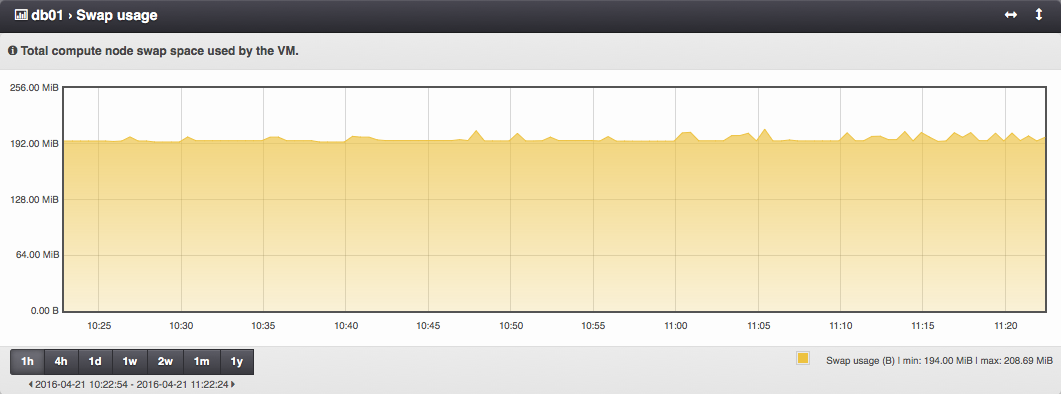
Swap usage - Total compute node swap space used by the virtual machine.
NIC Graphs
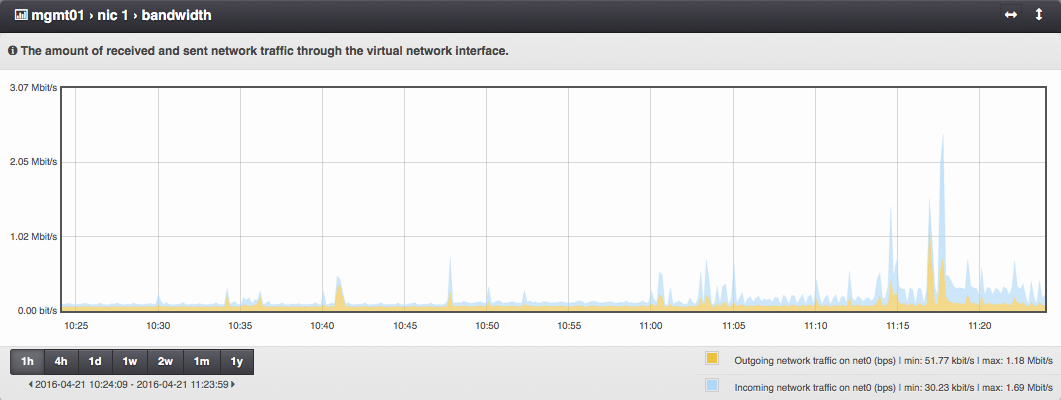
NIC bandwidth - The amount of received and sent network traffic through the virtual network interface.
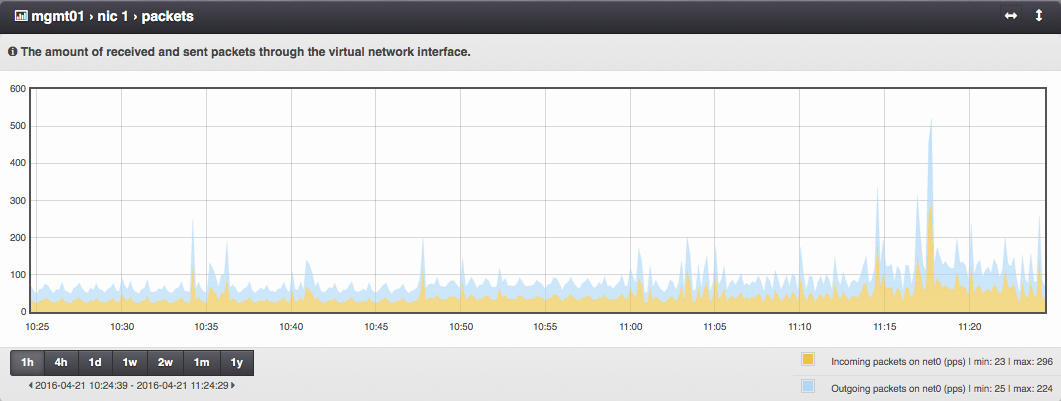
NIC packets - The amount of received and sent packets through the virtual network interface.
Disk Graphs
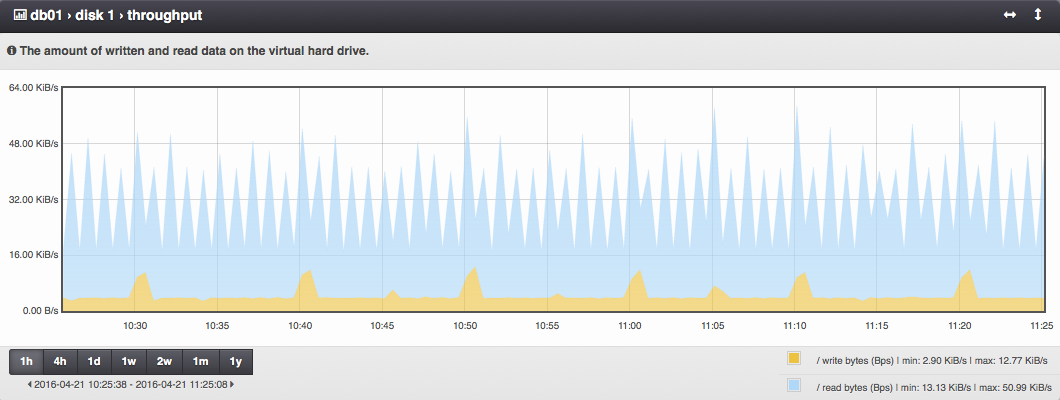
Disk throughput - The amount of written and read data on the virtual hard drive.
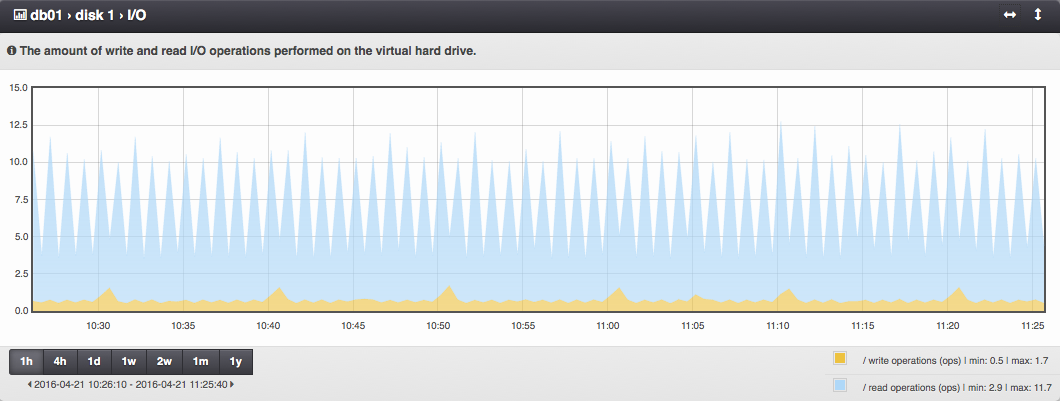
Disk I/O - The amount of write and read I/O operations performed on the virtual hard drive.
Aggregated Disk Layer Graphs
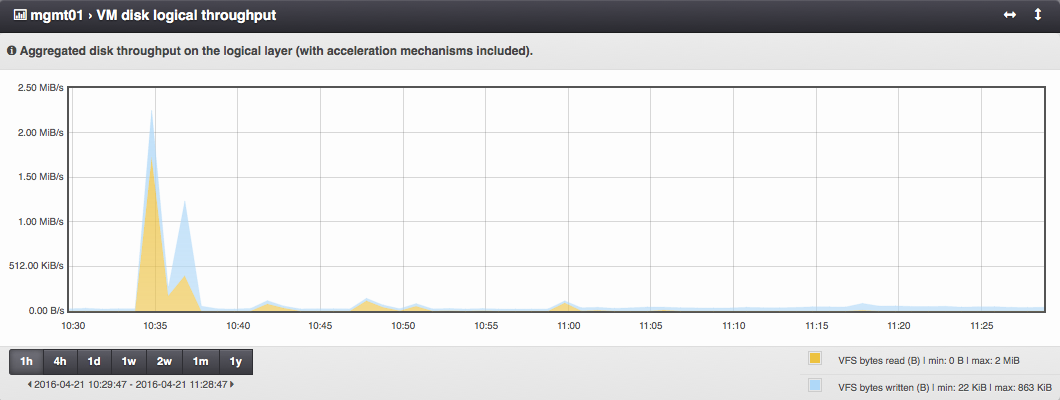
VM disk logical throughput - Aggregated disk throughput on the logical layer (with acceleration mechanisms included).
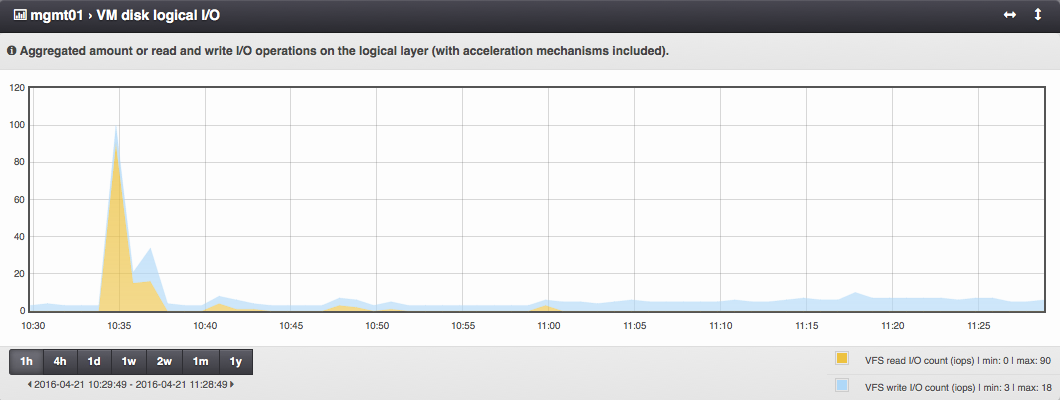
VM disk logical I/O - Aggregated amount or read and write I/O operations on the logical layer (with acceleration mechanisms included).
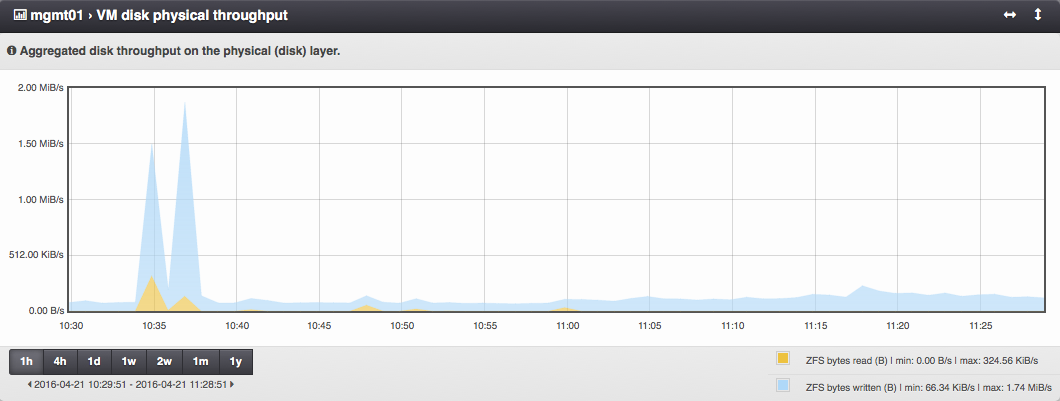
VM disk physical throughput - Aggregated disk throughput on the physical (disk) layer.
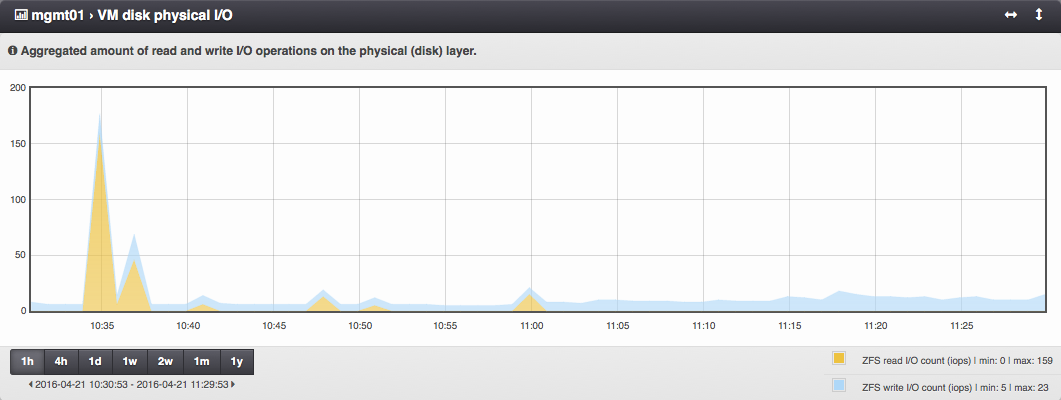
VM disk physical I/O - Aggregated amount of read and write I/O operations on the physical (disk) layer.
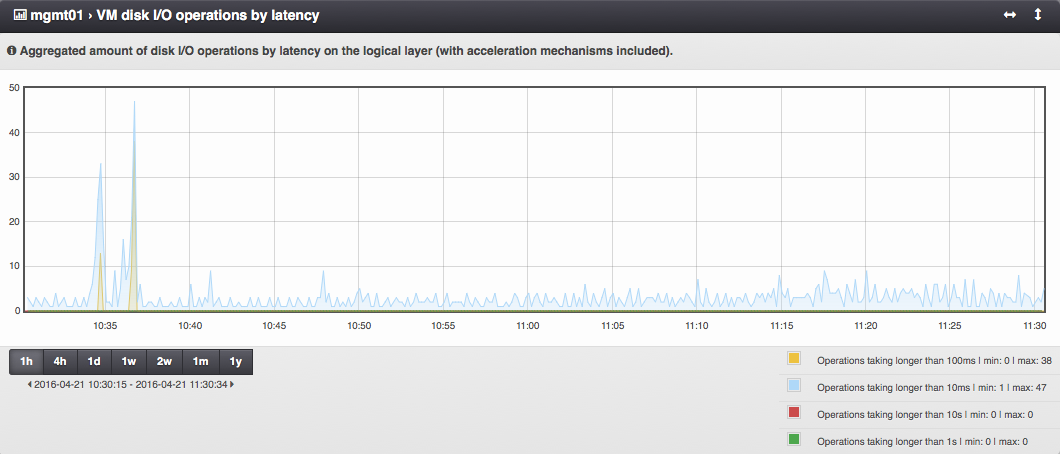
VM disk I/O operations by latency - Aggregated amount of disk I/O operations by latency on the logical layer (with acceleration mechanisms included).
